01
Relevant zones, not every FVG
The indicator evaluates FVG and IFVG structures in the context of the trend across multiple higher timeframes.
HTF EMAs + IFVG works on the 5-minute chart for the Nasdaq-100. It displays relevant FVG and IFVG zones, places them in the context of EMA trend structure across multiple higher timeframes, and adds session, calendar, risk and break-even management to the workflow.
PRACTICAL DAY-TO-DAY VALUE
No guesswork in front of the chart: the indicator combines setup validation, position sizing and trade planning in a single view.
The indicator evaluates FVG and IFVG structures in the context of the trend across multiple higher timeframes.
Session, trading day and confirmed EMA structures provide the framework before a zone qualifies as a setup.
Position size, stop and target zones, daily limit and optional break-even management remain visible in one workflow.
The checklist visualizes the setup as it develops. A TradingView alert can notify you when a potential opportunity appears.
THE ON-CHART WORKFLOW
Every signal passes through a defined filter sequence. Before entering, you see exactly which conditions are met and how much risk is planned.
Trading session, market day and confirmed EMA structures across multiple timeframes define the broader context.
Relevant FVG and IFVG zones are marked on the chart and only qualify as setups after rule-based confirmation.
Position size, stop and target zones, daily limit and optional break-even management guide the rest of the trade.
HISTORICAL REFERENCE BACKTEST
The cumulative reference evaluation transparently shows how the rule set performed in the Nasdaq-100 over the approx. 1-year evaluation period.
MMplatinum HTF EMAs + IFVG
Reference backtest (approx. 1 year) · $500 stop risk per trade
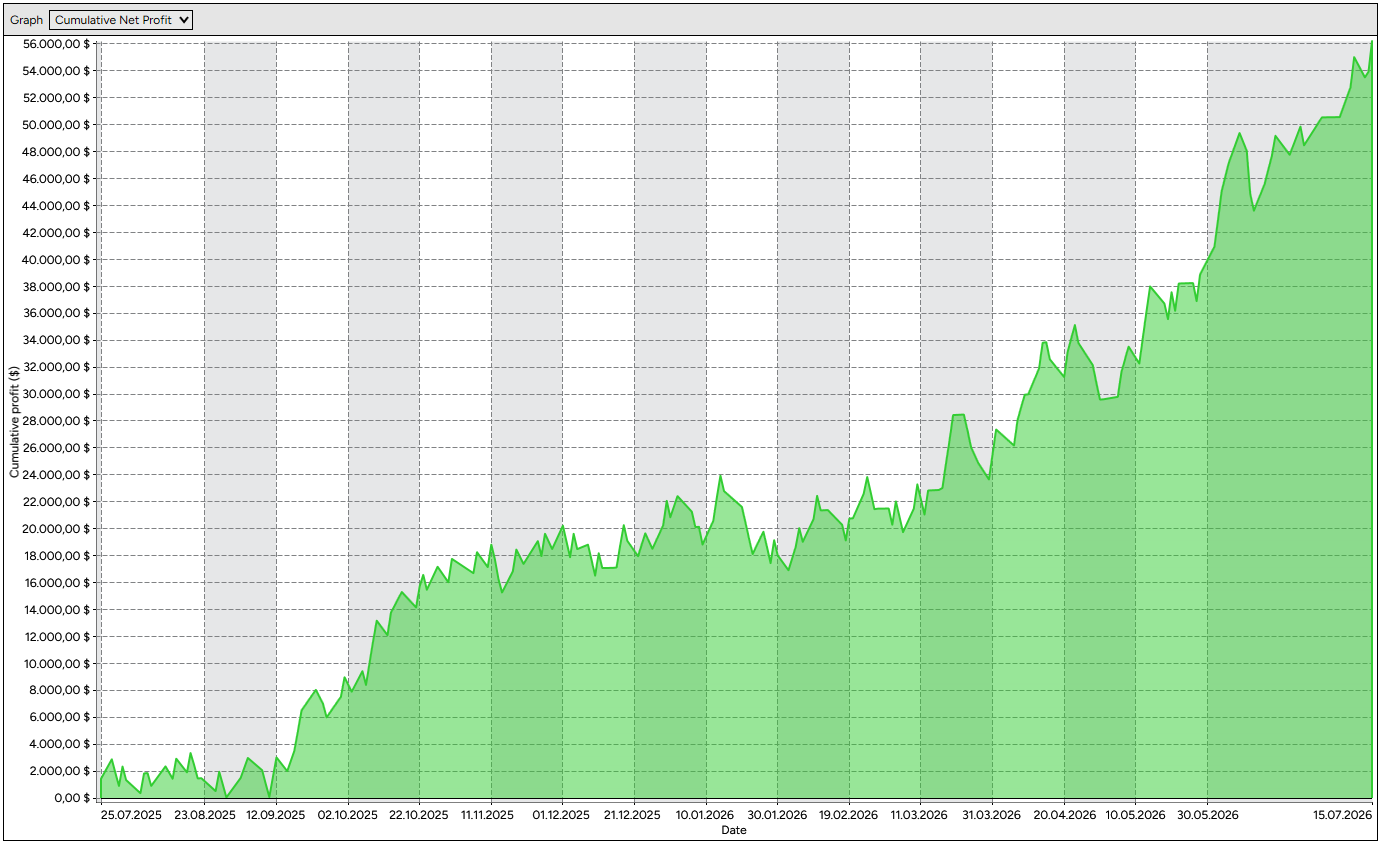
Data basis note: Historical simulation assuming a constant $500 stop risk per trade (excluding slippage and commissions). Past performance is not a reliable indicator or guarantee of future results.
WHO IS IT BUILT FOR?
This indicator is not built to fire random arrows all day — it is a structured decision framework for patient, rule-based traders.
PREFER AUTOMATED EXECUTION?
In NinjaTrader, the strategy handles setup validation, order placement and trade management automatically according to its configured rules.
ACCESS & PRICING
Unlock this specific rule set for your TradingView account — or get all three indicators for Gold and the Nasdaq-100 bundled together.
SINGLE INDICATOR ACCESS · Nasdaq-100 · IFVG
Full invite-only access to this indicator including all on-chart visualizations, position sizer and updates.
$247/ year
Equivalent to just $20.58 / month (47% savings compared with monthly billing)
You confirm your preferred billing cycle (monthly or yearly) in the next step at checkout.
COMPLETE SUITE · ALL 3 INDICATORS
RECOMMENDEDCombine XAU Momentum (Gold), EMAs + VWAP Trend (NQ) and HTF EMAs + IFVG (NQ) at the bundle rate.
$597/ year
Equivalent to just $49.75 / month (50% savings compared with monthly billing)
You confirm your preferred billing cycle (monthly or yearly) in the next step at checkout.
Risk disclosure: Trading financial instruments involves substantial risk. Historical backtests and indicators are for informational purposes only and do not constitute investment advice or a guarantee of profit.
READY FOR YOUR FIRST SETUP?
Unlock personal access for your TradingView username or get all three rule sets together in the Complete Suite.
Still have a question?Write to us directly