Market context at a glance
See whether the local EMA structure, higher-timeframe trend and session VWAP are all supporting the same direction.
How do you want to trade?
Choose manual or automated execution.
A possible signal is not enough. What matters is whether it agrees with the higher-timeframe trend and the active session.
EMAs + VWAP Trend works on the 5-minute chart for Nasdaq Futures and corresponding Nasdaq CFDs. It combines the local EMA structure with the confirmed higher-timeframe trend and session VWAP. Signals, ATR-based risk zones and end-of-day management are displayed directly on the chart.
Nasdaq Futures & CFDs · EMA and VWAP Confluence
Original view · TradingView
Markets
Nasdaq Futures · Nasdaq CFDs
Timeframes
5 min. + HTF context
Primary session
Asian – London
Chart View
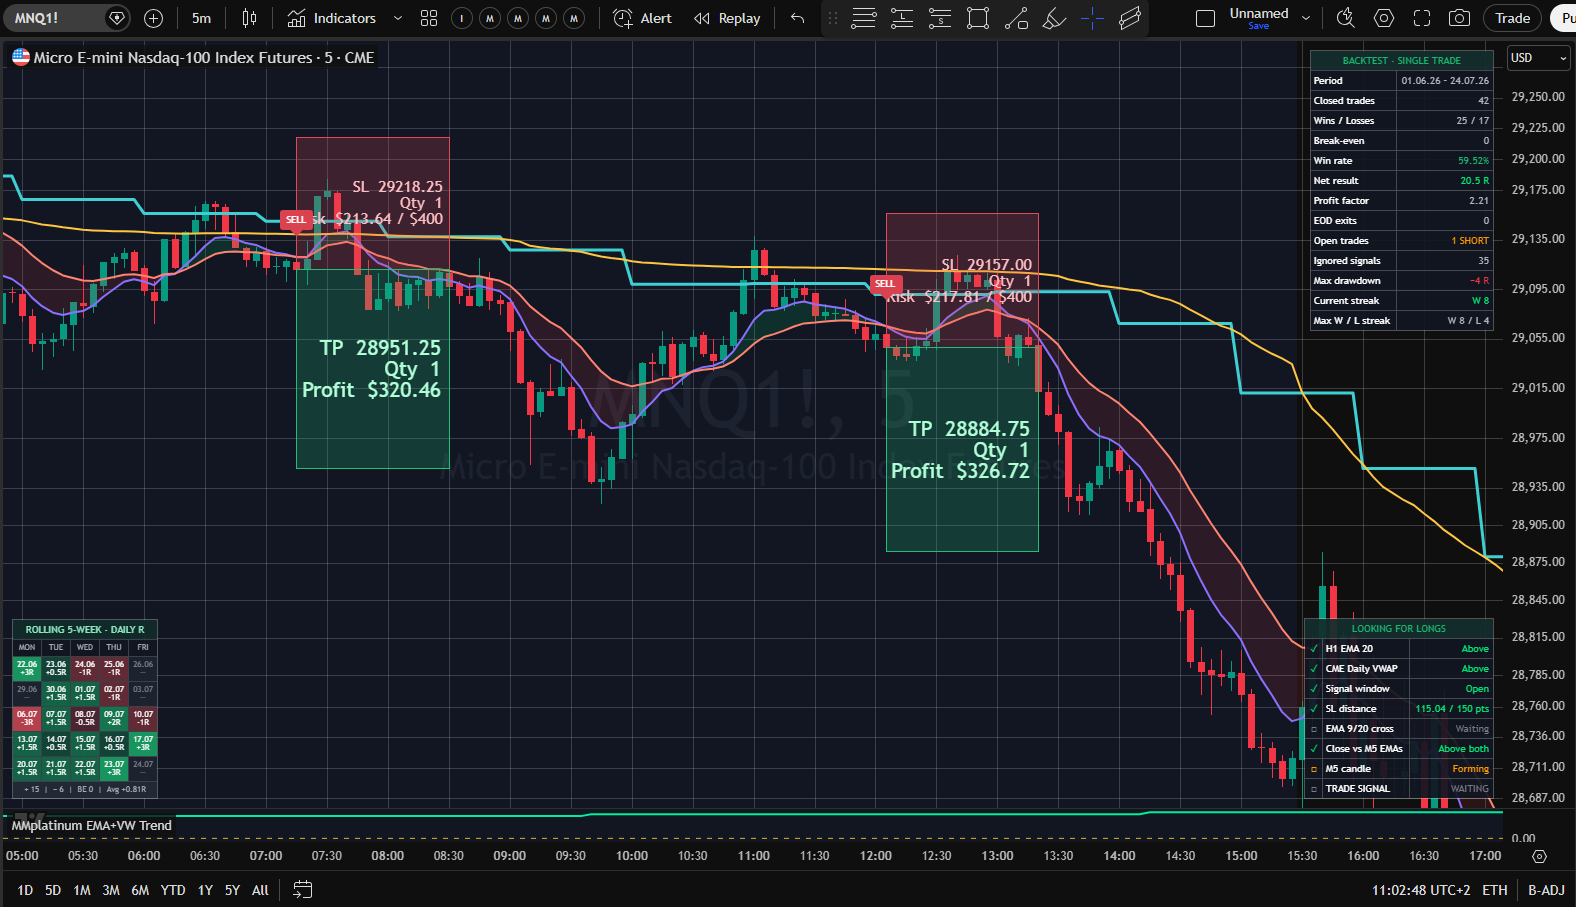
Signals, entry, stop-loss, take-profit and position size appear exactly where the decision is made: directly on the TradingView chart.
The original indicator view with signal, risk box, backtest table, performance calendar and setup checklist.
Fully configurable, with the long-term backtest settings provided as a tested starting point.
Nasdaq Futures & CFDs · EMA and VWAP Confluence
Originalansicht · TradingView
Practical day-to-day value
Not simply more information, but a clear process for the decisions that matter before and during a trade.
See whether the local EMA structure, higher-timeframe trend and session VWAP are all supporting the same direction.
A possible entry only becomes relevant when it aligns with the broader trend and session context.
ATR-based risk zones, position sizing and end-of-day management give every setup the same structure.
The checklist shows which conditions are already in place. A TradingView alert can notify you when a potential setup begins to develop.
Long-term perspective
The long-term chart shows how the indicator performed through trending, ranging and volatile market phases.
MMplatinum EMAs + VWAP Trend · Long-term chart
Long-term backtest · Cumulative performance
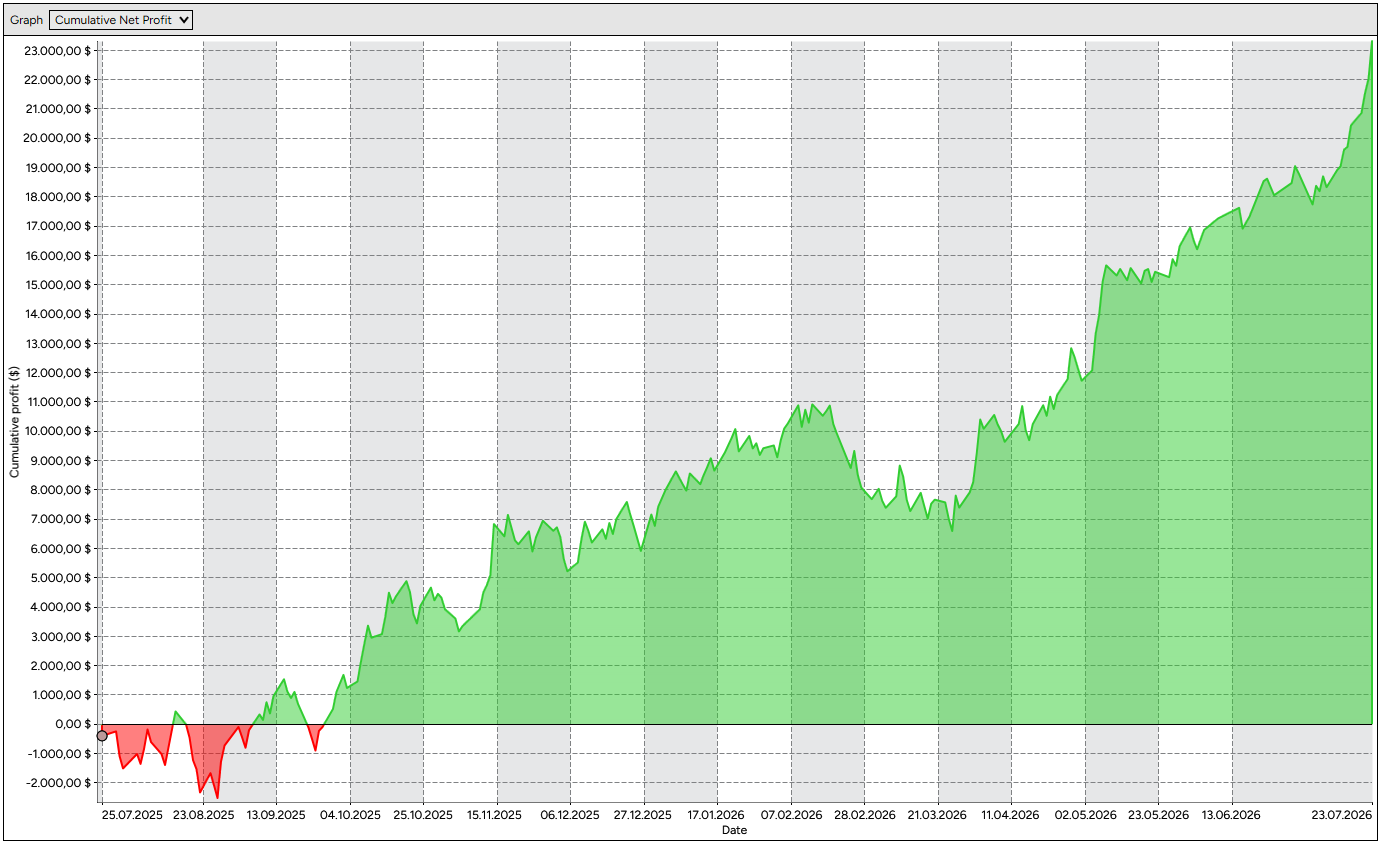
All results shown were calculated with a fixed maximum risk of $500 per trade.
Win rate
50%
Profit factor
1.45
Avg. RRR
1.47
Trades
344
Historical backtest under defined conditions. Maximum drawdown is based on the closed-trade equity curve. Past performance does not guarantee future results.
Anatomy of a planned trade
Each indicator turns a complete set of trading rules into a visible process. You see more than a signal: you see the conditions behind it and the risk planned for the trade.
The higher-timeframe trend and session VWAP define the broader trading direction.
A potential trade only appears when the local EMA structure agrees with the broader context.
ATR-based risk zones, position sizing and a clearly defined end to the trading day provide a consistent framework.
Built for a more disciplined approach
These indicators are for traders who want to make better decisions, not simply more of them – with patience, rules and clearly defined risk.
The corresponding NinjaTrader strategy handles setup validation, order execution and trade management according to its configured rules.
Everything included
From setup validation to performance review, every key step stays on your TradingView chart.
One Indicator
Monthly access
Annual access
RecommendedSave 47% · equivalent to $20.58 per month
Choose monthly or annual access in the next step.
Compare the Complete SuiteStill have questions?
Everything you may want to know before choosing access.