01 · Statement vs. Journal
Broker statements record cash, not logic
A brokerage report shows fills, timestamps, and commissions. Your trading journal connects every fill to setup rules, market regime, chart screenshots, and execution discipline.
A trading journal connects raw brokerage fills with your playbook logic, initial planned risk (1R), chart context, and behavioral discipline—turning scattered trades into an objective feedback loop that highlights what genuinely produces edge.
QUICK DEFINITION
A trading journal is a structured log of executed trades combining price, fees, and net P&L with setup playbook tags, initial planned risk (1R), chart screenshots, and rule compliance—making your true statistical edge measurable while isolating preventable behavioral leaks.
DEFINITION & PURPOSE
Statements record ending equity. Lasting consistency requires answering three questions a ticket export stays silent on:
01 · Statement vs. Journal
A brokerage report shows fills, timestamps, and commissions. Your trading journal connects every fill to setup rules, market regime, chart screenshots, and execution discipline.
02 · Edge vs. Leaks
Traders frequently discard profitable playbooks simply because unscripted FOMO trades mask the real expectancy. Tagging rule compliance keeps edge visible.
03 · Structured Iteration
Within 30 to 50 logged trades, your journal quantifies exactly which trading window, setup, and market regime produce consistent return on risk.
REAL-WORLD CASE STUDY (24 TRADES · 1R = $150)
Looking strictly at the blended monthly balance (+$1,090) often pushes traders to tweak a solid strategy. Splitting results by rule compliance immediately reveals what actually needs fixing:
BLENDED STATEMENT TOTAL
+$1,09054.2% Win Rate · 1.45 Profit Factor. Looking strictly at the broker balance makes results feel inconsistent.
STRICTLY ON-PLAN SETUPS
+$1,98061.9% Win Rate · +13.2R net gain. The underlying playbook shows a clean, repeatable statistical edge.
PREVENTABLE LEAKS
-$8900% Win Rate · -5.9R erased. Three unscripted trades wiped out nearly 45% of the entire month.
THE 8 ESSENTIAL METRICS
Win rate alone misleads almost everyone. Combining risk normalization (R-Multiple), payoff asymmetry, drawdown control, and behavioral attribution (on-plan vs. rule-break cost) exposes real optimization leverage.
01 · Hit Ratio
Percentage of profitable trades. Dangerous in isolation because high hit rates still lose money whenever a few wide stops erase weeks of wins.
Example: 27 winners across 50 trades = 54.0%.
02 · Payoff Efficiency
Gross dollars won divided by gross dollars lost. Sustained values above 1.30–1.50 leave margin against spreads and execution friction.
Example: $6,400 profit ÷ $3,200 loss = 2.00.
03 · Expected Edge
Combines win rate and payoff asymmetry into expected net return per setup execution over a representative sample.
Example: (0.50 × $380) − (0.50 × $190) = +$95 per trade.
04 · Normalized Risk Unit
Expresses P&L in multiples of initial stop risk (1R) so +2.5R means the same whether risking $100 or $1,000.
Example: +$450 net P&L risking $150 = +3.0R.
05 · Capital Preservation
Worst peak-to-trough decline before reaching new highs. Essential for sizing survival and respecting prop-firm daily/max limits.
Example: $50,000 peak dropping to $47,000 = -6.0%.
06 · Process Consistency
Percentage of entries and exits obeying your playbook rules, isolating behavioral execution from short-term P&L luck.
Example: 44 of 50 trades strictly on plan = 88%.
07 · Payoff Asymmetry
Compares average net profit on winners to average net loss on losers. Paired with win rate, this ratio proves whether your winners meaningfully outweigh your losses.
Practice check: $311 avg win ÷ $223 avg loss = 1.40 payoff ratio.
08 · Behavioral Leverage
Splits your total P&L into on-plan playbook setups versus rule breaks (FOMO, revenge entries, widened stops)—quantifying the exact cost of unstructured deviations.
Practice check: +$2,187 following rules vs. -$588 lost across two impulse trades.
BENCHMARKS & LOG STRUCTURE
Use these practical reference ranges when evaluating a 30+ trade sample, then keep your daily data entry focused on the eight essential columns below.
| Metric | What It Measures | Warning Sign | Healthy Practical Range | Common Trap |
|---|---|---|---|---|
| Profit Factor | Gross profit per dollar lost | < 1.15 (thin cost buffer) | 1.40 to 2.40 | Overfitting on fewer than 20 trades |
| Expectancy (R) | Average net R earned per trade | ≤ 0.00R after commissions | +0.15R to +0.60R+ | Ignoring brokerage fees & swap drag |
| Max Drawdown (%) | Largest peak-to-trough decline | > 12–15% (emotional / prop breach risk) | 3% to 8% | Checking daily cash instead of equity peak |
| Rule Adherence Rate | Share of strict checklist trades | < 80% (behavior drives losses) | ≥ 90% | Marking lucky rule breaks as clean executions |
| Win Rate | Share of profitable trades | Meaningless without avg R:R | 35% (trend) to 65% (scalp) | Chasing 80% hit rate by widening stop losses |
Objective Execution Data
Context, Playbook & Psychology
3-TIER TAGGING & REVIEW WORKFLOW
Inconsistent tags corrupt multi-month filters. Split playbook, market regime, and execution behavior into clean layers paired with a compact daily/weekly cadence.
Tier 01 · Setup Tags
Tier 02 · Regime Tags
Tier 03 · Behavior Tags
Step 01 · Pre-Market (5 Min)
Step 02 · Post-Exit (2 Min)
Step 03 · Weekly Review (20 Min)
TAILORED BY TRADING STYLE
An intraday futures scalper faces different failure modes than a multi-week equity swing trader or someone protecting trailing prop-firm limits:
Day Trading & Scalping
At higher trade frequency, session timing, commission drag, and tilt control determine survival. Log exact entry windows, session tags, and stop trading immediately after hitting a daily discipline cap.
Swing & Position Trading
Multi-day holds depend on broader market regime, overnight gap risk, catalysts/earnings, and scaling logic. Reviewing before/after chart screenshots across key swing levels shows whether trailing stops cut trend runners too early.
Prop Firm Challenges
Hard daily loss limits and trailing drawdowns punish behavioral tilt brutally. Real journal ratios—win rate, payoff asymmetry, and 1R risk—let you test survival odds accurately before paying reset fees.
COMMON PITFALLS & 30-DAY ROLLOUT
Most traders stop journaling out of perfectionism or selective omission. Follow this four-week ramp to turn tracking into an automatic edge habit.
Mistake 01
Skipping tilted losing days out of frustration blinds your data completely. The painful outliers carry the highest diagnostic leverage.
Mistake 02
Complex spreadsheets die within two weeks. Start lean with core execution fields, risk (1R), setup, and rule compliance before adding nuance.
Mistake 03
Active intraday systems regularly lose 15–30% of edge to commissions and swaps. Always analyze net return after fees.
Mistake 04
A clean -1R stop-out is strong execution; a reckless winner without a stop builds toxic habits. Grade process independently from outcome.
Mistake 05
Dollar P&L mixes position-size changes with actual strategy quality. R-Multiples keep multi-month trends apples-to-apples.
Mistake 06
Logging without reflection is glorified filing. Reserve 20 uninterrupted minutes each weekend to extract concrete adjustments.
30-DAY ROADMAP
Log every single trade without exception—just symbol, initial risk (1R), net P&L, and On-Plan Yes/No. Consistency beats complexity.
30-DAY ROADMAP
Tag each fill under your named playbooks and pick just three mistake flags (e.g. FOMO, Early Exit, Widened Stop).
30-DAY ROADMAP
Write pre-session guardrails before the open and attach entry/exit screenshots immediately after closing each ticket.
30-DAY ROADMAP
Rank setups by R-Multiple, calculate exact rule-break cost, and isolate one process change for month two.
BASIC LOGGING VS. PROGRESSION
If your only goal is tracking basic bookkeeping columns, a solid spreadsheet works cleanly. Once you want to actively accelerate performance through annotated chart context, strict playbook validation, Backtest Lab verification, and AI analysis on your own executions, you need a dedicated trading journal.
SPREADSHEET (BASIC STATS)
PROFESSIONAL JOURNAL · LIFETIME
LIFETIME ACCESS WITHOUT SUBSCRIPTIONS
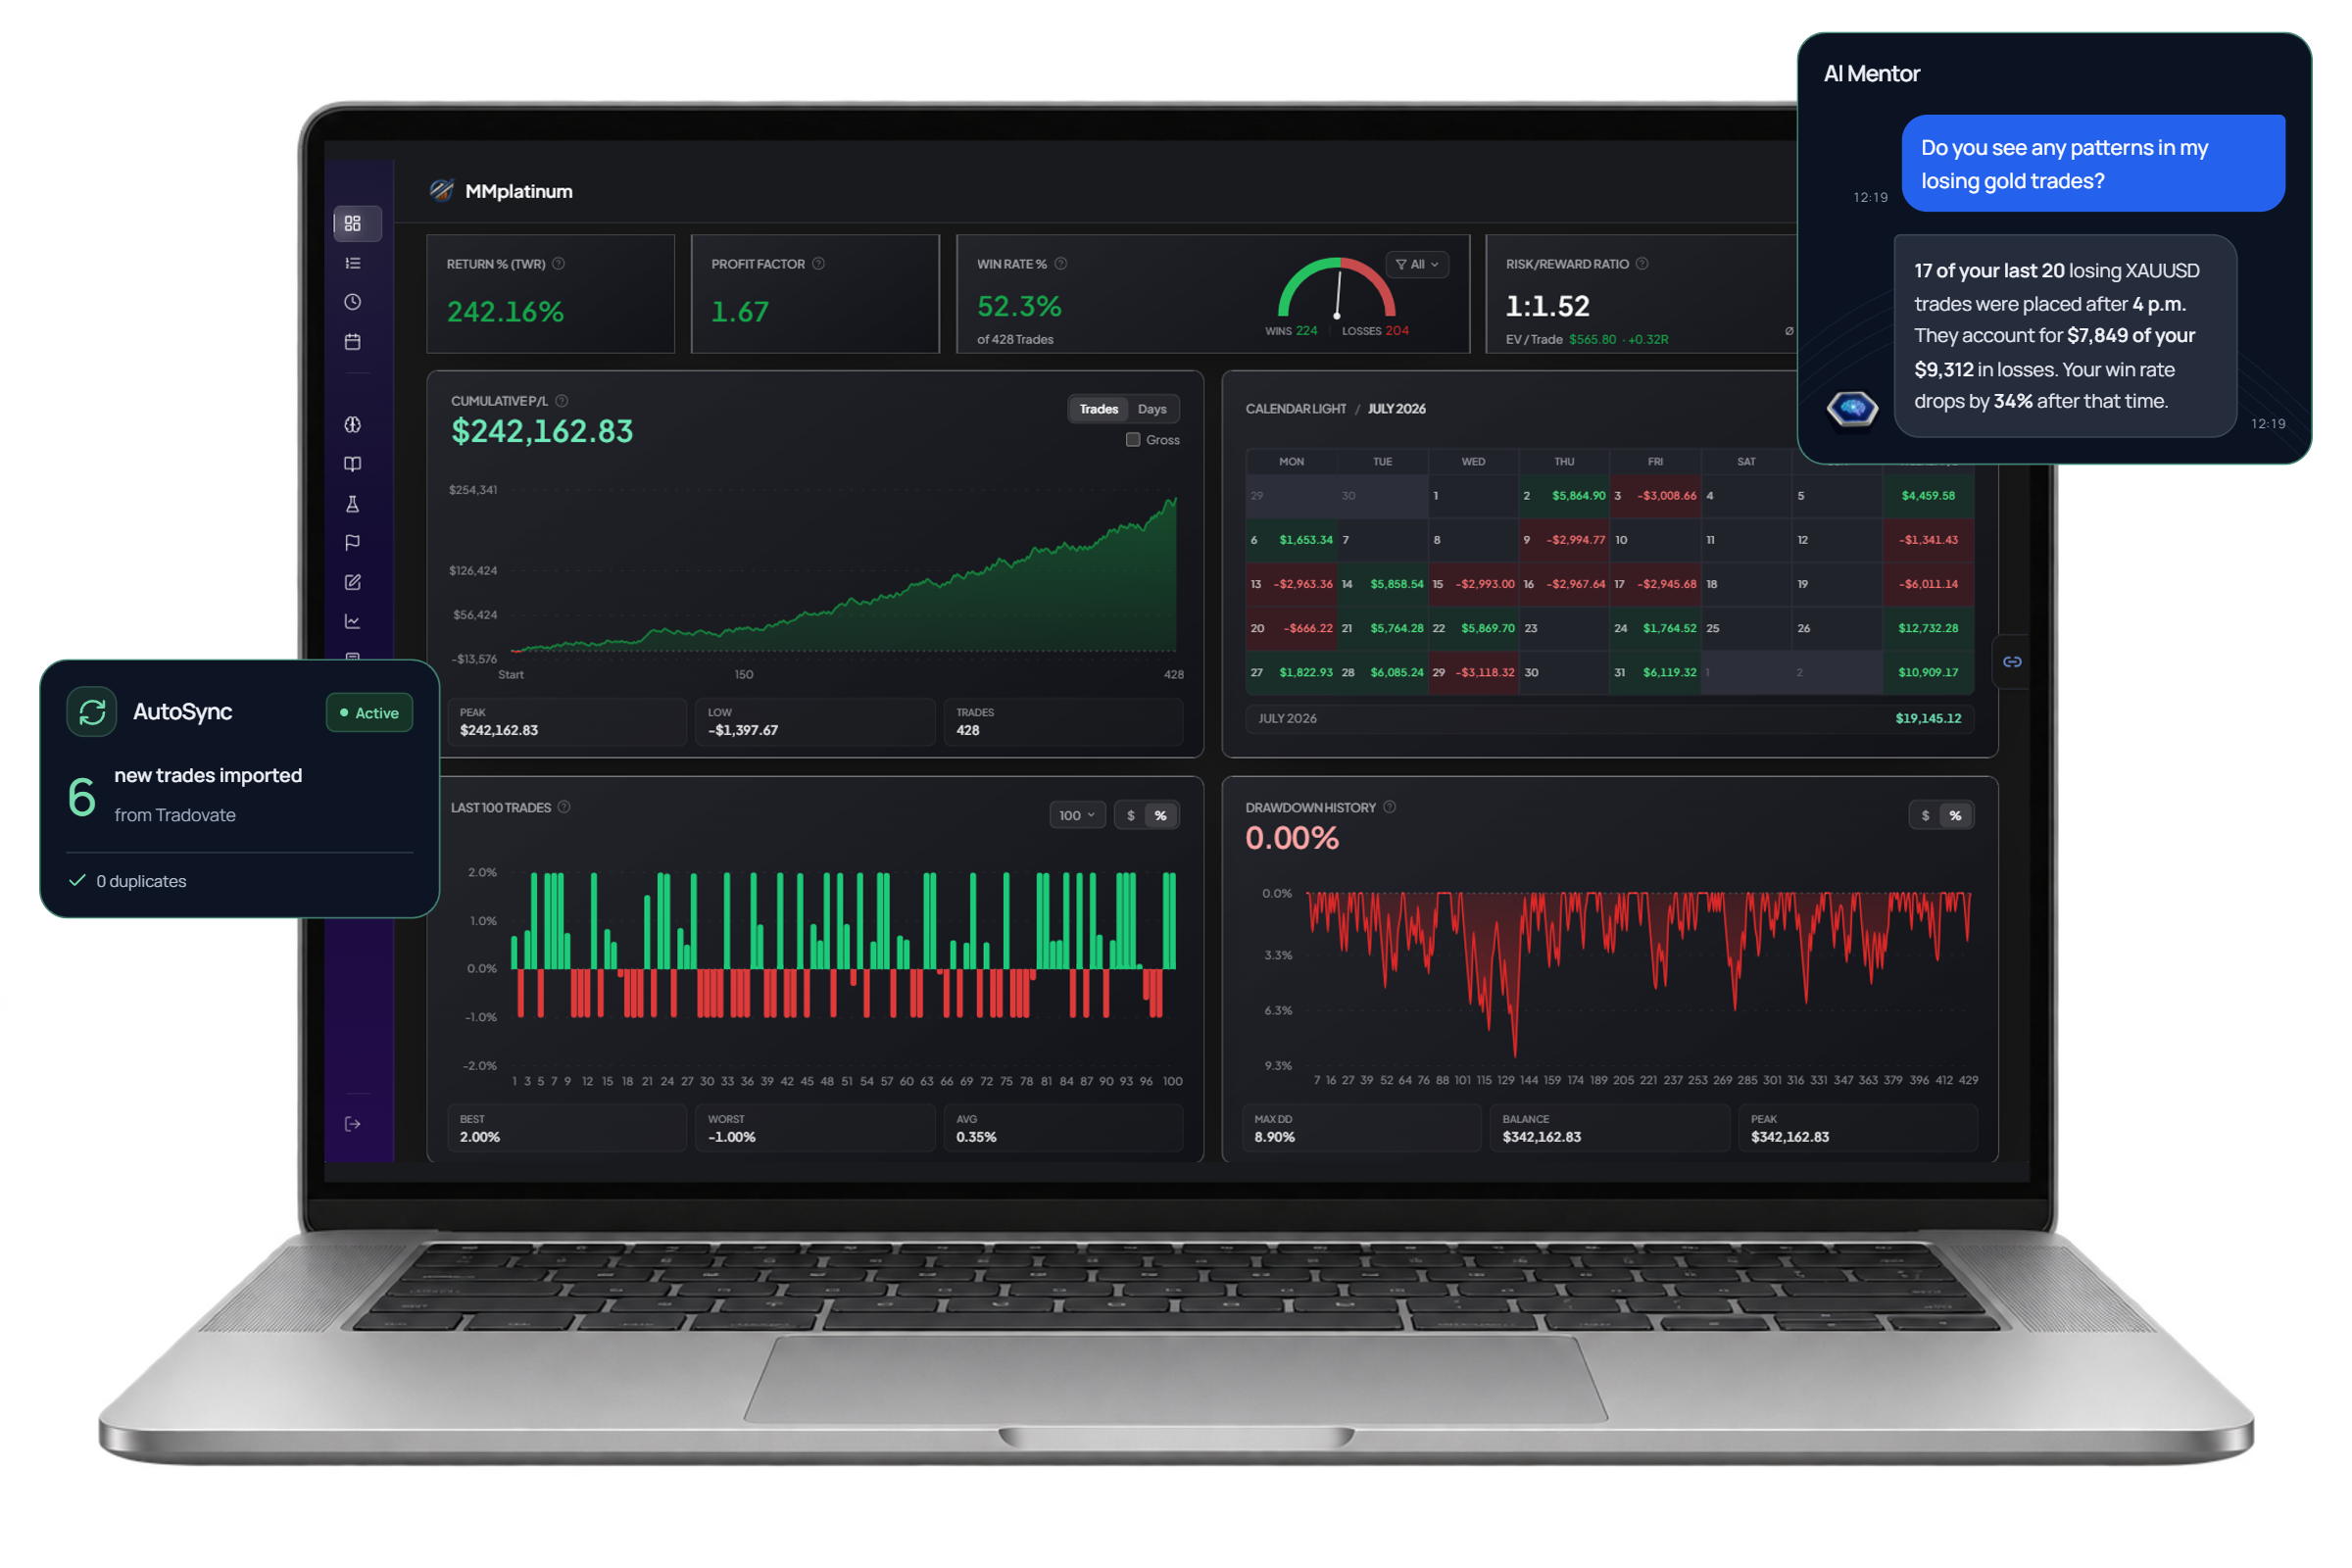
Use our ungated 5-tab .xlsx workbook for clean core stats—or upgrade into MMplatinum with Playbooks, Backtest Lab, AI Mentor, and connectivity across 30+ platforms and 500+ brokers.
FREQUENTLY ASKED QUESTIONS
A trading journal is a structured performance log connecting raw trade executions with setup rationale, initial stop risk (1R), net P&L after fees, chart screenshots, and rule compliance. While a broker statement shows what your balance did, a journal reveals why it happened and which habits need refinement.
BUILT FOR DELIBERATE PROGRESS
Try MMplatinum Trading Journal free for 7 days with zero card required—including Playbooks, unlimited screenshots, Backtest Lab, 40+ analytics widgets, AI Mentor, and connectivity across 500+ brokers.
No payment details required for the 7-day trial · optionally $99 one-time afterwards, no subscription.