Impact-Site-Verification: 70274732-2ab4-45ae-805a-4d265fce480b

    Free Trading Journal Template (.xlsx)with live Dashboard, Formulas & Equity Curve.

    Far more than a blank ledger: download a native 5-tab .xlsx workbook complete with an embedded Equity Curve, automated setup & discipline breakdowns, playbook checklists, dropdowns, and fee-adjusted analytics—immediately with zero email gate.

    • Native .xlsx (zero warnings) & CSV
    • 5 tabs: Dashboard, Log, Playbooks, Review & Guide
    • Embedded Equity Curve chart & dropdowns

    INTERACTIVE COCKPIT & INSTANT EXPORT

    Test metrics live.
    Export the full 5-tab .xlsx workbook.

    These 12 three-week sample executions show the real gap between disciplined playbook trading and impulsive leaks. Add custom rows below or export your customized 5-tab workbook right away.

    Download complete 5-tab Excel workbook (.xlsx)

    Includes KPI Dashboard with Equity Curve chart, 250 formula rows with R-Multiple & Drawdown, Playbook Matrix, Weekly Review & Quick Start.

    1 · Dashboard15 KPIs, native Equity Curve chart, Setup & Discipline tables
    2 · Trade-Log250 formula rows with fees, R-Multiple, Drawdown % & dropdowns
    3 · Playbooks5 complete setup rulebooks including triggers & no-go filters
    4 · Weekly ReviewWeekly accountability grid for leaks & next-week focus
    5 · Quick StartInput color key, workflow steps & formula overview
    Net P&L & Balance$1,599.00Balance: $11,599 (+16.0%)
    Win Rate & Expectancy66.7%8W / 4L · Ø $133.25 / Trade
    Profit Factor2.79Fees incl.: $60.00
    Total R-Multiple+10.66RØ +0.89R / Trade
    Max Drawdown-3.75%-$420.00 from equity peak
    Rule Compliance & Leak83%Rule breaks: -$588.00

    Live Equity Curve (Baseline: $10,000)

    Start: $10,000Current: $11,599On Plan: $2,187.00

    Setup Attribution (Live Ranking)

    Session High Sweep2 Trades (100%)$950.00
    Opening Range2 Trades (100%)$509.00
    HTF Trend Pullback2 Trades (100%)$426.00
    London Breakout2 Trades (50%)$280.00
    VWAP Rejection2 Trades (50%)$22.00

    Discipline Impact (On Plan vs. Rule Break)

    On Plan (10 trades)80% Win$2,187.00
    Rule Breaks (2 trades)Preventable drag-$588.00
    Theoretical Net Without Leaks$2,187.00
    DateSessionSymbolSideSetup / PlaybookRiskNet P&LROn PlanRemove
    2026-10-05LondonXAUUSDLongLondon Breakout$150.00$430.00+2.87ROn Plan
    2026-10-06New YorkNQShortVWAP Rejection$150.00-$154.00-1.03ROn Plan
    2026-10-07LondonDAX40LongOpening Range$150.00$282.00+1.88ROn Plan
    2026-10-07New YorkNQLongNo Setup / Impulse$150.00-$318.00-2.12RRule Break
    2026-10-08LondonEURUSDLongHTF Trend Pullback$150.00$323.00+2.15ROn Plan
    2026-10-09OverlapXAUUSDShortSession High Sweep$150.00$475.00+3.17ROn Plan
    2026-10-12New YorkESShortVWAP Rejection$150.00$176.00+1.17ROn Plan
    2026-10-13LondonXAUUSDLongLondon Breakout$150.00-$150.00-1.00ROn Plan
    2026-10-14New YorkNQShortNo Setup / Impulse$150.00-$270.00-1.80RRule Break
    2026-10-15OverlapXAUUSDShortSession High Sweep$150.00$475.00+3.17ROn Plan
    2026-10-16LondonDAX40LongOpening Range$150.00$227.00+1.51ROn Plan
    2026-10-19LondonEURUSDLongHTF Trend Pullback$150.00$103.00+0.69ROn Plan

    Add a sample trade to update metrics & .xlsx export

    INSIDE THE .XLSX WORKBOOK

    Built like a real analytics desk,
    not just a bare P&L sheet.

    All five tabs are linked cleanly so you move from raw ticket entries to reliable setup expectancy and realistic inputs for tools like our Prop Firm Challenge Calculator.

    01 · Balance, Equity Curve & Drawdown

    Track account compounding & risk realistically

    Starting from your editable capital baseline, the workbook calculates net P&L after commissions, cumulative balance, and peak-to-trough drawdown—feeding directly into the embedded native Excel Equity Curve.
    02 · Playbook & Session Attribution

    See which setups and hours actually pay

    Clean dropdowns standardize Session (London, New York, Overlap, Asia) and Playbook tags. Dynamic SUMIFS/COUNTIFS tables immediately break down wins, win rate, net P&L, and R by setup.

    03 · Initial Risk (1R) & R-Multiple

    Compare setups consistently across account sizes

    R-Multiple divides Net P&L by planned 1R stop risk. Knowing an A+ setup delivers +2.4R puts every win and loss on the same scale even as position size grows.

    04 · Rule Adherence vs. Discipline Cost

    Measure what impulse trades really drain

    Split clean executions from emotional detours automatically. Even inside the 12-trade sample above, the 10 on-plan setups earn over $2,170 while just 2 rule breaks erase nearly $590.

    BASIC TRACKING VS. REAL PROGRESSION

    Track core stats cleanly—
    or actively engineer better execution.

    Spreadsheets log basic totals reliably. Yet when your goal is active skill progression—connecting chart context, pre-market routines, Backtest Lab validation, deep behavioral analytics, and AI coaching—a static workbook quickly shows its ceiling.

    BASIC BOOKKEEPING

    Free Excel / CSV Template

    PROFESSIONAL JOURNAL · LIFETIME

    MMplatinum Trading Journal · $99

    Logs essential bookkeeping numbers: Net P&L, R-multiple, simple setup totals, and rule checkboxes.
    Deep root-cause diagnostics across 40+ composable widgets (Session × Weekday × Holding Time × Setup × Mistake Tag).
    No structured connection between morning pre-market plans, entry checklists, and annotated charts.
    Every execution linked directly to unlimited chart screenshots, daily pre-market planning, voice notes, and rulebooks.
    Evaluating strategy tweaks means guessing or risking live/prop-firm capital without proper backtesting.
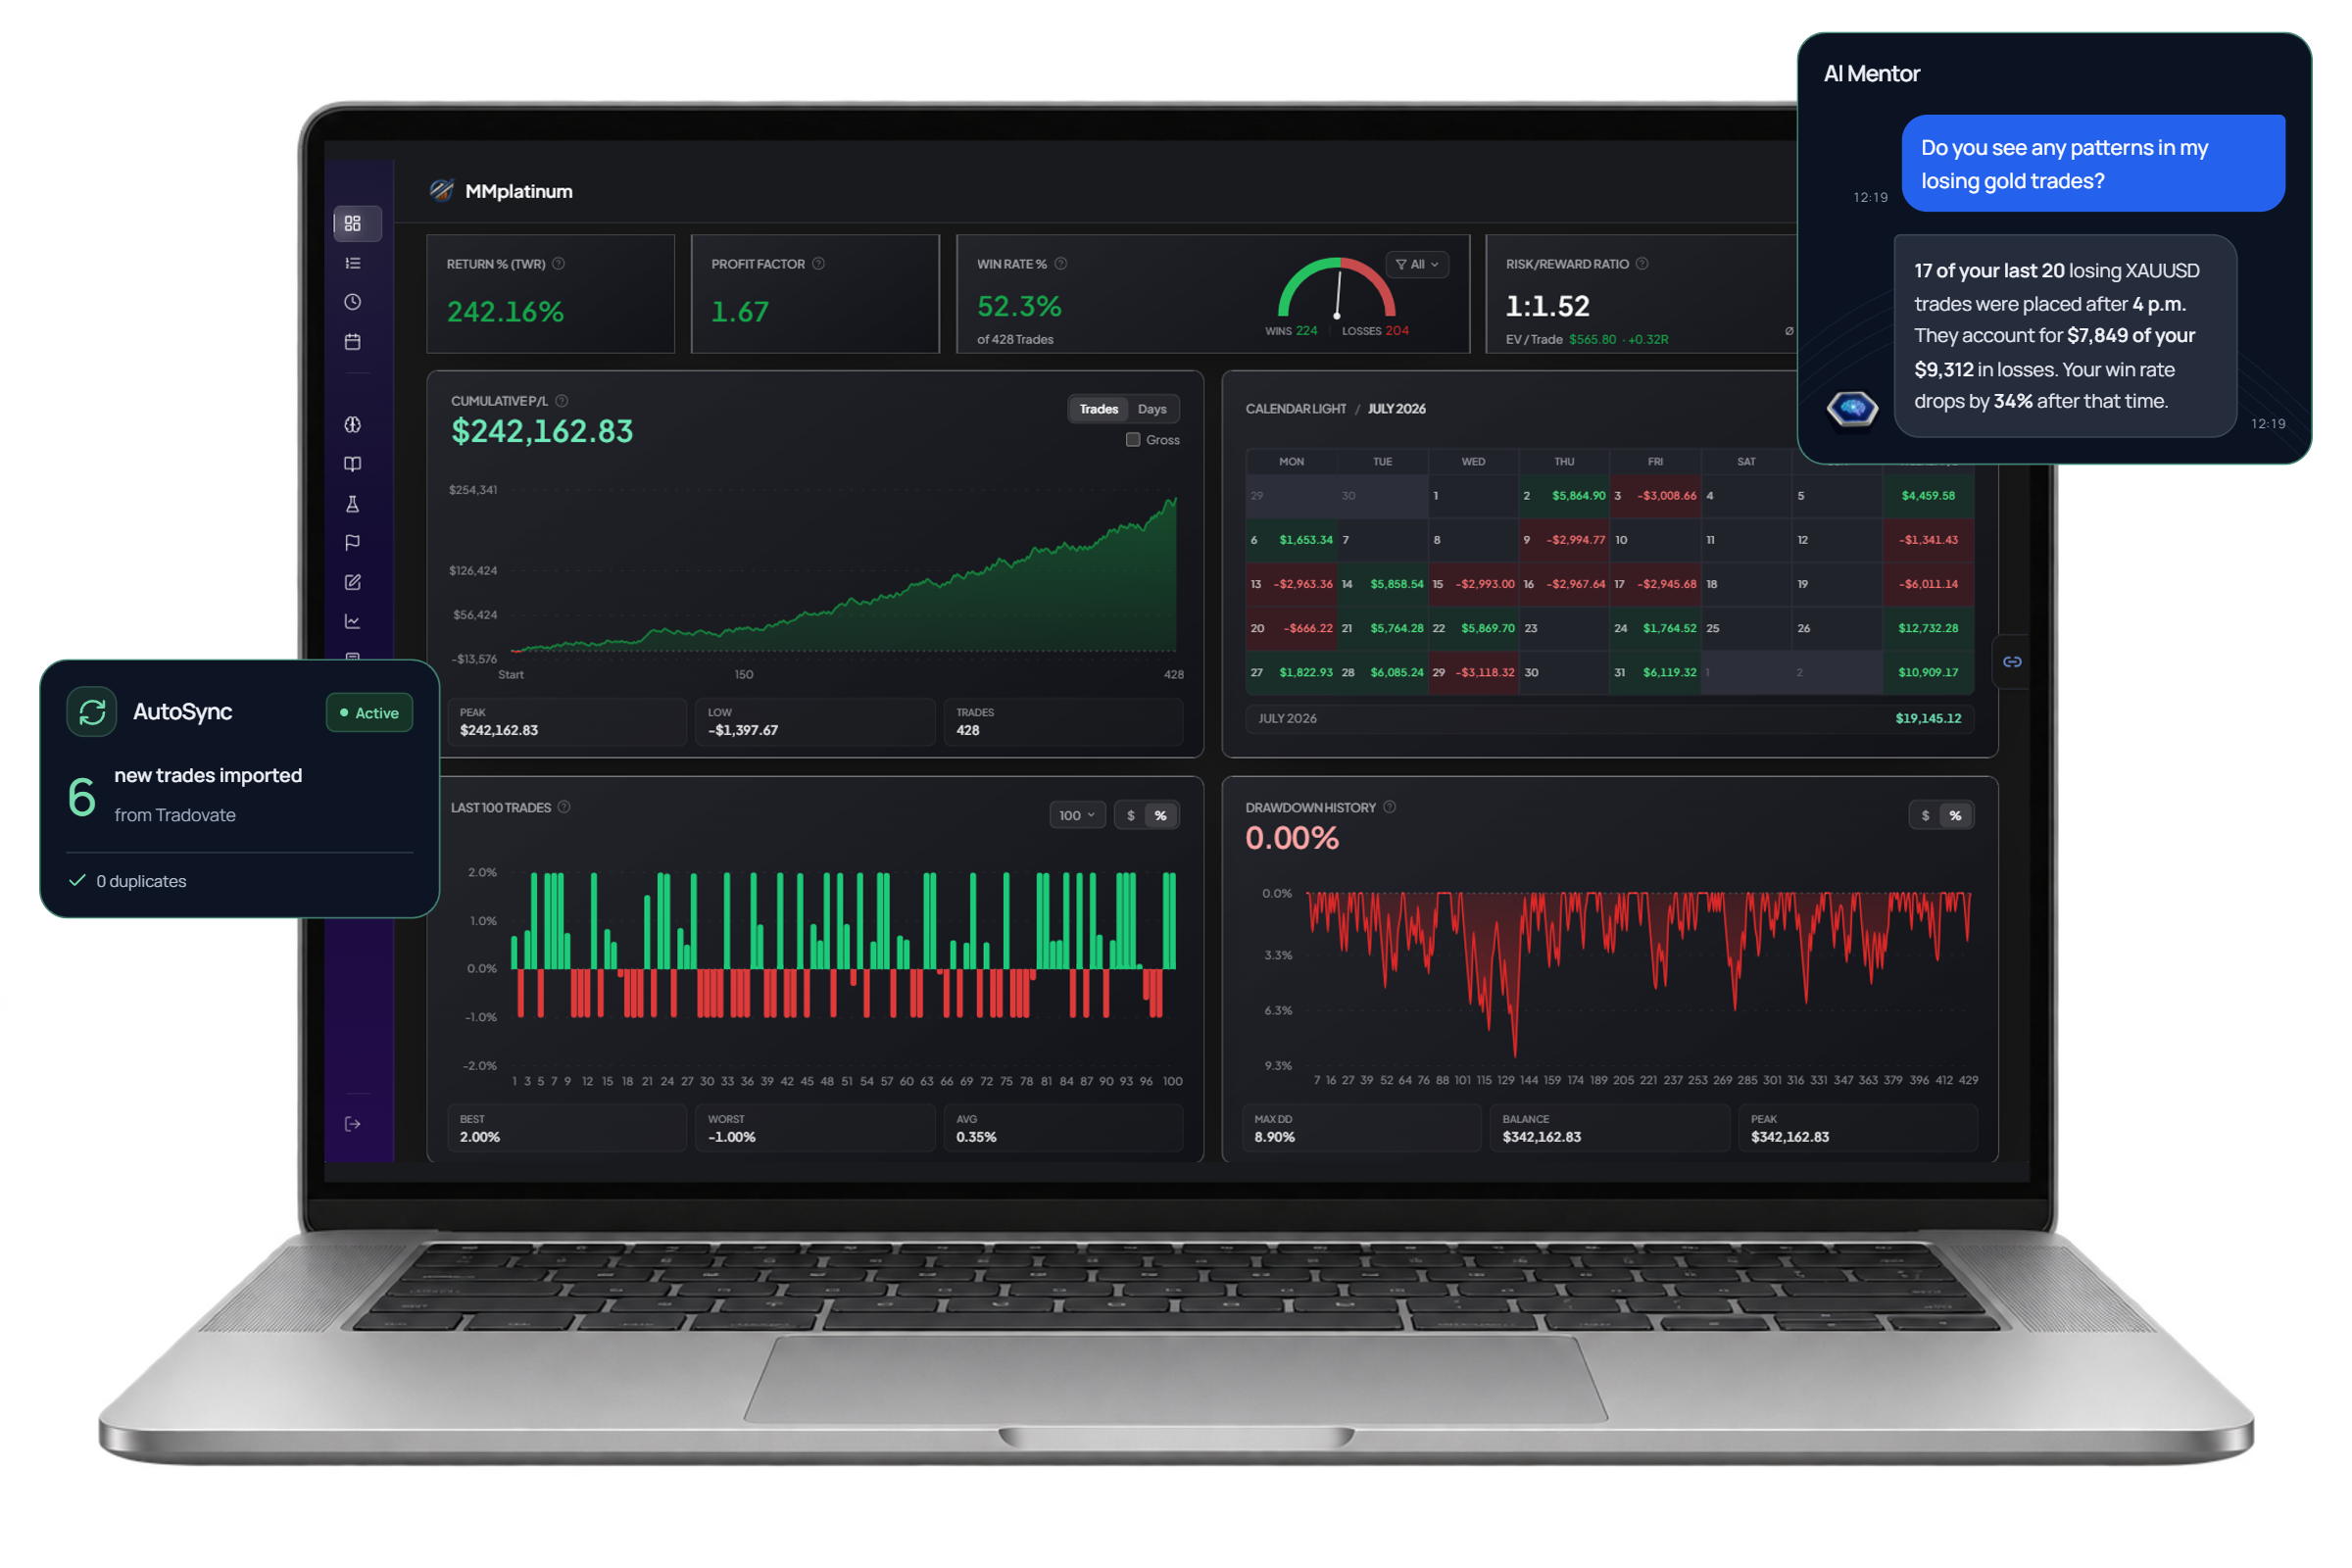
    Built-in Backtest Lab to validate ideas cleanly plus an AI Mentor & read-only MCP bridge reading your real trade data.
    Manual trade entry breaks down once you trade multiple accounts, scale positions, or review high volume.
    Reliable automated data pipeline across 30+ platforms and 500+ brokers (AutoSync & Smart CSV) freeing time for deliberate review.
    MMplatinum Trading Journal software with playbooks, 40+ analytics widgets, Backtest Lab and AI Mentor

    BUILT FOR TRADERS SERIOUS ABOUT PROGRESS

    Beyond logging tickets.
    One-time access instead of subscriptions.

    Keep using our free .xlsx workbook for foundational logging—or upgrade into MMplatinum with Playbooks, Backtest Lab, AI Mentor, and connectivity across 30+ platforms and 500+ brokers.

    TEMPLATE QUESTIONS

    Everything about the template.
    Clear answers before you start.

    You get a genuine native .xlsx workbook with five structured tabs: an automated KPI Dashboard with an embedded Equity Curve chart, setup attribution, and discipline impact comparison; a 250-row Trade-Log with dropdown menus, commissions, and drawdown formulas; a Playbook Matrix; a Weekly Review tracker; and a Quick Start guide—with zero legacy file-format warnings.

    READY FOR STRUCTURED PROGRESS?

    Move from basic tracking
    to deliberate skill building.

    Start cleanly with our free 5-tab .xlsx workbook—or try MMplatinum free for 7 days with Playbooks, Backtest Lab, visual reviews, and your personal AI Mentor.

    No payment details required for the 7-day trial · optionally $99 one-time afterwards, no subscription.

    Educational DisclaimerSample trades and calculated ratios are provided strictly to illustrate workbook structure. They do not constitute financial advice, trade recommendations, or a guarantee of future performance.